Supply Chain Network Design Case Study
Found optimal network configuration for highly constrained network
Project Summary:
-
Determined optimal network configuration for unconstrained scenario, plus two more scenarios with network constraints and pressures.
-
Compared optimal network configuration costs to calculated baseline (current-state) costs.
-
Our model reduced network costs by 45%, for a savings of $59 million!
-
Made data-driven business recommendations based on our findings.
Files:
-
View Final Report here
-
Download Excel spreadsheet w/ Solver model (.xlsx)
- Preview only (.html) - does not render perfectly
- Uses Solver, OpenSolver - due to large number of variables, doesn’t work with built-in Solver
- GroupBy.html and Q10-Revenue.html
- HTML outputs. Used Python (Pandas, Numpy) to prep data
Sample Findings:
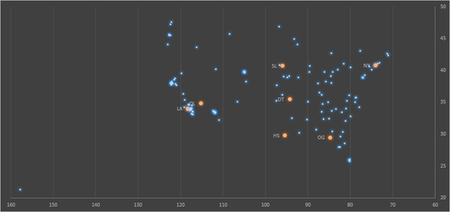
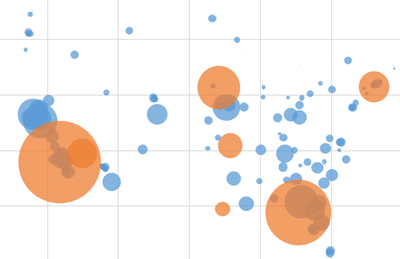
Map of customers (blue) and DCs (orange) (More)
Our model reduced network costs by 45%, for a savings of $59 million!
By allowing for split quantities, i.e. relaxing binary constraints on Decision Variables, our model allowed all customers to be served and all demand to be met - even when distribution centers had limited capacity, three distribution centers were closed, and total network demand was increased by 15%. (More)
Tools Used: Regex, Python (Pandas, Numpy), Excel, Solver, OpenSolver
Course: DSB 6200 Supply Chain Analytics, Wayne State University
Assignment: Final Term Project (XRetailer Supply Chain Network Design Problem Case Study)
Submitted: May 7, 2018
Last Updated: May 9, 2018


